


This article is part of our According to the Data series.
In two recent articles, I have detailed when production declines in running backs both in terms of age and also number of career carries. I received many comments asking if these results were valid for the top RBs. In response, I have completed a similar analysis of the top-300 RBs below.
Data
I collected the yardage statistics of the top 300 career rushers from NFL.com. Note, this data set contains only RBs whose careers began after 1950 (sorry Joe Perry) and spans from 1950 to 2013. Note, if a player did not have a carry in a season, this season was not included in the data set.
Analysis of Data
The first thing I would like to showcase is the average values of a few metrics broken down in the top 10, 50, 100, 200 and 300 of the data. See the table below:
| Avg Seasons played | Avg No. of Games | Avg Career Carries | Avg Carries/Season | Avg of Career High of Carries | Avg of Career Yds | |
|---|---|---|---|---|---|---|
| Top 10 | 11.7 | 171.2 | 3260.7 | 278.7 | 357.0 | 14238.6 |
| Top 50 | 11.1 | 152.3 | 2461.7 | 225.9 | 339.5 | 10564.9 |
| Top 100 | 9.8 | 131.5 | 1981.1 | 204.1 | 321.2 | 8429.1 |
| Top 200 | 9.0 | 118.0 | 1543.9 | 173.2 | 285.9 | 6457.8 |
| Top 300 | 8.4 | 110.0 | 1295.8 | 154.8 | 261.9 | 5376.7 |
This table shows a few things. First all the metrics decrease as the data set size increases with the exception of career yards. This is to be expected. The second observation is the number of seasons with a carry in comparison to
In two recent articles, I have detailed when production declines in running backs both in terms of age and also number of career carries. I received many comments asking if these results were valid for the top RBs. In response, I have completed a similar analysis of the top-300 RBs below.
Data
I collected the yardage statistics of the top 300 career rushers from NFL.com. Note, this data set contains only RBs whose careers began after 1950 (sorry Joe Perry) and spans from 1950 to 2013. Note, if a player did not have a carry in a season, this season was not included in the data set.
Analysis of Data
The first thing I would like to showcase is the average values of a few metrics broken down in the top 10, 50, 100, 200 and 300 of the data. See the table below:
| Avg Seasons played | Avg No. of Games | Avg Career Carries | Avg Carries/Season | Avg of Career High of Carries | Avg of Career Yds | |
|---|---|---|---|---|---|---|
| Top 10 | 11.7 | 171.2 | 3260.7 | 278.7 | 357.0 | 14238.6 |
| Top 50 | 11.1 | 152.3 | 2461.7 | 225.9 | 339.5 | 10564.9 |
| Top 100 | 9.8 | 131.5 | 1981.1 | 204.1 | 321.2 | 8429.1 |
| Top 200 | 9.0 | 118.0 | 1543.9 | 173.2 | 285.9 | 6457.8 |
| Top 300 | 8.4 | 110.0 | 1295.8 | 154.8 | 261.9 | 5376.7 |
This table shows a few things. First all the metrics decrease as the data set size increases with the exception of career yards. This is to be expected. The second observation is the number of seasons with a carry in comparison to the number of games. The number of seasons for the top 10 and 50 are about the same, but the average number of games is greater by about 19 for the top 10. This difference equals 1.2 seasons. This indicates the top RBs were able to stay healthy at a much higher rate. The next item is the average carries per season and the career high for carries in a season. These two measures point to the amazing durability of the top 10 and 50 RBs.
The next set of data is the average yards per season for these five groups versus age, as well as the number of players for that age.
| Top 10 | Top 50 | Top 100 | Top 200 | Top 300 | ||||||
|---|---|---|---|---|---|---|---|---|---|---|
| Age | No. of Players | Avg Yds | No. of Players | Avg Yds | No. of Players | Avg Yds | No. of Players | Avg Yds | No. of Players | Avg Yds |
| 20 | 0 | - | 2 | 1436.0 | 3 | 1076.3 | 3 | 1076.3 | 4 | 932.0 |
| 21 | 6 | 1123.2 | 15 | 889.6 | 24 | 784.5 | 39 | 652.2 | 52 | 580.6 |
| 22 | 9 | 1379.8 | 41 | 958.6 | 69 | 861.5 | 129 | 683.9 | 189 | 614.9 |
| 23 | 10 | 1361.3 | 48 | 1053.4 | 96 | 859.6 | 180 | 749.4 | 271 | 674.4 |
| 24 | 10 | 1333.9 | 50 | 1038.9 | 98 | 995.8 | 192 | 844.9 | 289 | 743.1 |
| 25 | 10 | 1415.1 | 49 | 1162.8 | 100 | 1063.5 | 193 | 871.3 | 286 | 762.9 |
| 26 | 10 | 1407.7 | 50 | 1237.8 | 97 | 1085.5 | 194 | 858.3 | 285 | 745.3 |
| 27 | 10 | 1456.3 | 49 | 1186.5 | 96 | 1024.5 | 189 | 809.0 | 274 | 686.2 |
| 28 | 10 | 1243.5 | 47 | 1007.5 | 89 | 850.4 | 172 | 707.0 | 242 | 608.8 |
| 29 | 10 | 1257.7 | 44 | 1030.9 | 76 | 862.0 | 143 | 671.6 | 198 | 563.1 |
| 30 | 9 | 1091.0 | 44 | 793.4 | 75 | 665.1 | 124 | 562.6 | 161 | 481.4 |
| 31 | 8 | 1123.3 | 37 | 762.9 | 57 | 602.7 | 93 | 498.3 | 108 | 457.1 |
| 32 | 8 | 680.1 | 30 | 567.1 | 40 | 510.5 | 62 | 420.7 | 71 | 388.4 |
| 33 | 4 | 583.0 | 21 | 458.9 | 25 | 461.0 | 39 | 353.1 | 44 | 326.1 |
| 34 | 2 | 479.5 | 12 | 427.7 | 15 | 431.1 | 19 | 408.7 | 23 | 346.0 |
| 35 | 1 | 937.0 | 6 | 579.3 | 8 | 461.6 | 9 | 419.1 | 11 | 348.6 |
| 36 | 0 | - | 3 | 535.0 | 4 | 457.8 | 5 | 421.6 | 6 | 351.7 |
| 37 | 0 | - | 1 | 505.0 | 1 | 505.0 | 1 | 505.0 | 1 | 505.0 |
Here is the graph if this table.
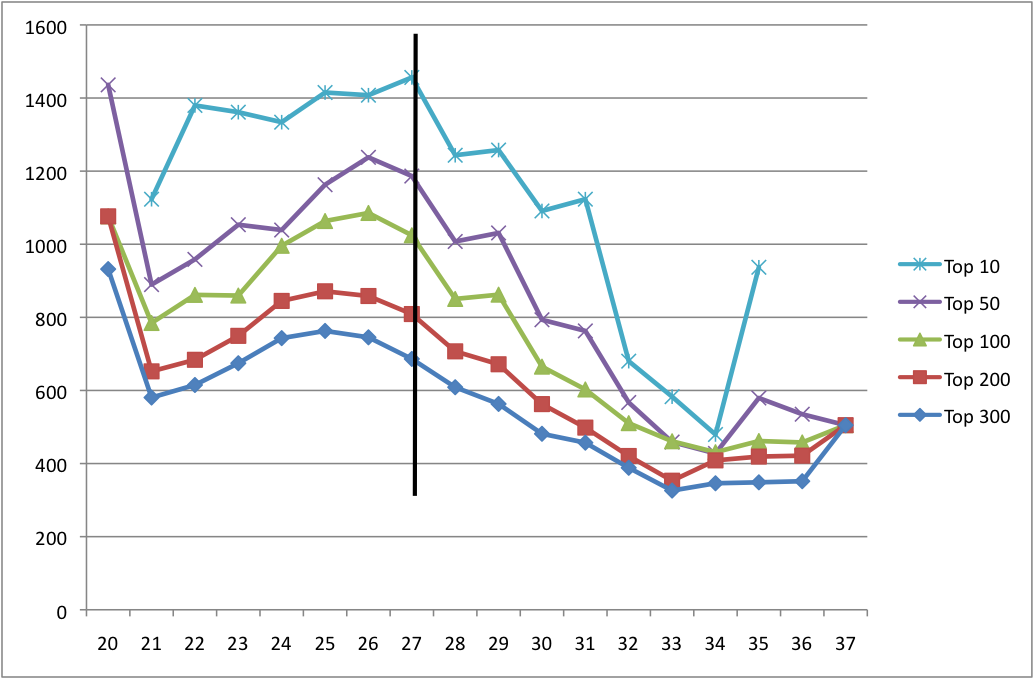
As expected, the production increases as you narrow the data, and as the data set increases there is a much smoother, normalized data line. The data indicate at age 27 a RB's production begins to decline, as noted by the solid black line. However, in the top 200 and 300, the decline perhaps begins at age 26, but the production in age 26 is only slightly lower than previous two years production.
This chart supports the notion that age 27, regardless of the talent of the RB, is the beginning of the decline. (Note: this graph does not include the number of players for the age groups as included in the table.)
The next table is the cumulative carries per season for these five groups versus age, as well as the number of players for that age.
| Top 10 | Top 50 | Top 100 | Top 200 | Top 300 | ||||||
|---|---|---|---|---|---|---|---|---|---|---|
| Age | No. of Players | Cumul Carries | No. of Players | Cumul Carries | No. of Players | Cumul Carries | No. of Players | Cumul Carries | No. of Players | Cumul Carries |
| 20 | 0 | - | 2 | 291.0 | 3 | 216.3 | 3 | 216.3 | 4 | 190.5 |
| 21 | 6 | 254.5 | 15 | 485.7 | 24 | 388.1 | 39 | 363.1 | 52 | 321.3 |
| 22 | 9 | 575.9 | 41 | 705.7 | 69 | 583.8 | 129 | 520.7 | 189 | 464.5 |
| 23 | 10 | 875.9 | 48 | 941.4 | 96 | 778.8 | 180 | 692.5 | 271 | 620.9 |
| 24 | 10 | 1165.5 | 50 | 1179.4 | 98 | 1006.3 | 192 | 889.1 | 289 | 796.1 |
| 25 | 10 | 1500.1 | 49 | 1446.5 | 100 | 1251.3 | 193 | 1095.9 | 286 | 978.9 |
| 26 | 10 | 1809.2 | 50 | 1728.0 | 97 | 1505.0 | 194 | 1299.6 | 285 | 1157.4 |
| 27 | 10 | 2130.9 | 49 | 2002.4 | 96 | 1748.1 | 189 | 1496.0 | 274 | 1326.3 |
| 28 | 10 | 2405.9 | 47 | 2241.1 | 89 | 1954.6 | 172 | 1668.7 | 242 | 1477.2 |
| 29 | 10 | 2676.1 | 44 | 2482.1 | 76 | 2160.0 | 143 | 1832.5 | 198 | 1615.4 |
| 30 | 9 | 2949.9 | 44 | 2673.7 | 75 | 2322.3 | 124 | 1972.4 | 161 | 1735.4 |
| 31 | 8 | 3217.5 | 37 | 2858.3 | 57 | 2471.1 | 93 | 2098.3 | 108 | 1850.9 |
| 32 | 8 | 3392.8 | 30 | 3002.5 | 40 | 2602.3 | 62 | 2206.9 | 71 | 1950.7 |
| 33 | 4 | 3552.8 | 21 | 3125.6 | 25 | 2724.9 | 39 | 2301.7 | 44 | 2037.9 |
| 34 | 2 | 3688.3 | 12 | 3242.0 | 15 | 2839.4 | 19 | 2410.1 | 23 | 2129.4 |
| 35 | 1 | 3955.3 | 6 | 3393.9 | 8 | 2959.5 | 9 | 2519.7 | 11 | 2220.9 |
| 36 | 0 | - | 3 | 3529.2 | 4 | 3078.5 | 5 | 2625.3 | 6 | 2309.0 |
| 37 | 0 | - | 1 | 3653.2 | 1 | 3202.5 | 1 | 2749.3 | 1 | 2433.0 |
Here is the graph of the above table without the number of players:
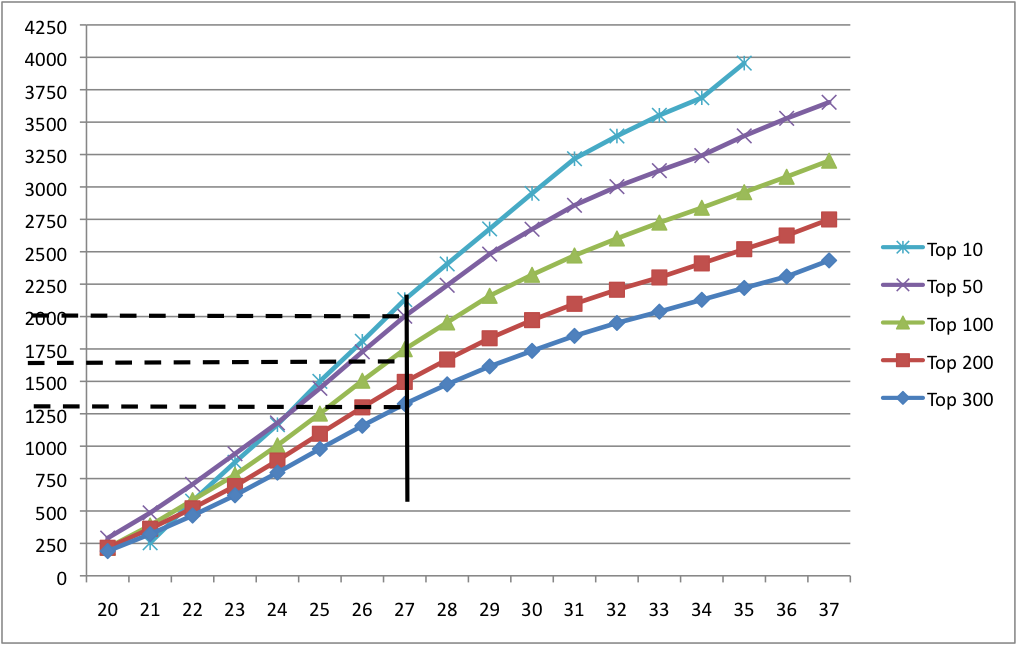
The graph shows, as expected, the higher the talent level the higher number of career cumulative carries. Age 27 is denoted with a solid black line. Dashed lines are drawn to show an estimation of the carries for the top 10, top 50, top 100, top 200 and top 300 groups. These values can also been found on the cumulative carries table.
Conclusion
It's kind of a no brainer, but generally, more talented RBs have a) more productive careers and b) longer careers. However, even the best of the best see a decline at age 27. With that said, even the decline of the best of the best RBs (Top 50) is almost as good as the productive years for the Top 100 RBs.
On the cumulative career carries, the carries at age 27 for the best of the best RBs (Top 10 and 50) is around 2,000 which is about twice the number from my original article about RBs cumulative career carries. However, finding a Top-50 RB of all time is a rarity, maybe 5-6 every 10 years. So these RBs don't grow on trees. For the fringe best of the best RB (Top 100), the decline happens around the 1,725-carry mark. For the last two groups, RBs in the Top 200 or 300, expect a decline to occur around the 1,400-carries mark. I would suggest the 1,400 number is a good estimate for when to expect a downturn in production for a decent to good RB in today's NFL.