This article is part of our NFL Observations series.
North American sports fans have been spoiled... at least in one sense. Not at the moment, of course, and not if we're talking about prices for tickets, concessions or cable/satellite TV packages. But in terms of stats and analytics, the past two decades brought impressive progress for nerdy fans, myself included, of the Big 4 professional sports leagues.
MLB teams were the original leaders in the analytics arena, while NFL teams generally have lagged behind, only just beginning to catch up in recent years. I mention this because I've noticed football fans on social media tend to be hostile toward new measures of performance, often criticizing before making an effort to understand — a behavior that maybe seems more normal than it should, given the current nature of mainstream political discourse. (I'm guilty of this as much as anyone.)
Many NFL fans have a special disdain for composite statistics; those which take a variety of inputs and spit out a single number that's intended to be a measure of value. Simplistic examples include 'fantasy points' and 'passer rating', but neither is especially effective for assessing a player's worth to his real-life team. Fantasy points disproportionately weigh volume and TDs over efficiency and yardage, while passer rating overemphasizes completion percentage and doesn't even attempt to account for rushing stats and sacks.
But those metrics aren't the ones commonly met with disdain. Instead, it's the newer or more complicated stats that tend to invite scorn — stuff like ESPN's QBR (quarterback rating), PFF's WAR (wins above replacement) and Football Outsiders' DVOA (defense-adjusted value above average). Part of the problem is a lack of transparency due to the formulas being proprietary, though it doesn't take a ton of effort to at least form some understanding of these statistics.
Full disclosure: I'm not a data analyst, nor am I attempting to be one. I studied economics as an undergrad in what feels like another lifetime, but I'd say I'm conversant more so than fluent when it comes to understanding advanced football stats. Knowing how to make use of the stats in some capacity is one thing; knowing the finer points is another (also, it's not always possible when the companies don't make that information available).
Anyway, the following tweet and the responses to it were my initial inspiration for writing about this topic:
Most valuable AFC North players over the last 5 years per PFF WAR
1. Ben Roethlisberger
— PFF (@PFF) June 15, 2020
2. Andy Dalton
3. Baker Mayfield
4. Antonio Brown
5. Joe Flacco pic.twitter.com/VvAGl4KY5t
For whatever reason, a lot of people saw this tweet and interpreted it as "Andy Dalton is better than Antonio Brown." But that isn't what WAR is measuring. Rather, this tweet is saying the difference between Andy Dalton and a replacement-level QB was greater (in terms of wins for his team) than the difference between Antonio Brown and a replacement-level WR.
The concept of "replacement level" is borrowed from baseball, where it's intended to correspond with the quadruple-A type players that can easily be acquired for minimal cost. For MLB, most sites use a baseline where a team strictly comprised of replacement-level players would be expected to win about 47-50 games out of 162. Similarly, PFF's WAR metric for the NFL suggests a team of replacement players would average a 3-13 record.
Our theoretical replacement team doesn't have Jared Goff throwing passes to Sterling Shepard and Kyle Rudolph; it's more like Kyle Allen chucking the rock in the general direction of Alex Erickson and Darren Fells. As fans, we tend to judge players by comparing them to league average (e.g. Goff, Shepard, Rudolph), but from the perspective of an NFL GM it's probably more helpful to compare all players to the replacement baseline (e.g. Allen, Erickson, Fells).
After all, there's a lot of real-life value in maintaining league-average performance over a large sample. Better players tend to get more volume, so Julio Jones' influence on the overall league average of 7.2 yards per pass attempt is much larger than Justin Hardy's. Perhaps you noticed that each of my three examples of a league-average player (Goff, Shepard, Rudolph) is signed to a considerable, multi-year contract.
Football gives us the added complication of huge differences in positional value, with the biggest gap being that between quarterbacks and all other players. NFL teams have long understood this, but they haven't always done a good job applying it, sometimes overpaying for mediocrity (e.g. Joe Flacco) and sometimes mistaking replacement level for mediocre (e.g. Brock Osweiler).
Actually, I'd argue that the infamous Flacco contract was only a slight overpay, but it looks really bad because the truly elite QBs are worth far more than they get. Of course it was ridiculous for Flacco and Aaron Rodgers to have similar contracts; the mob just had it wrong in identifying Flacco as the one whose contribution and compensation were totally out of whack.
Football isn't Baseball
We also need to remember that stats like WAR will never be as accurate for football as they are for baseball. There are 10-13 players on the diamond for any given play, and outcomes largely are determined by the one-on-one interaction between pitcher and batter. You don't need to be an analytics genius to acknowledge that measuring WAR for an MLB second baseman is a lot easier than trying to put a similar number on an NFL safety.
Even in basketball, which doesn't have the pitcher/batter factor, we're dealing with only 10 players on the court at a time, and far fewer potential outcomes for each play/possession relative to football. Plus, NBA teams average about 100 possessions per game over an 82-game schedule, while NFL teams average about 63 offensive plays (over 16 games).
Some may chose to interpret this argument as evidence of football analytics being overrated or even worthless, but i strongly disagree, preferring instead to make myself aware of the inherent limitations, not to mention the inevitably of continued progress in the coming years. If we dismiss everything that's imperfect, we end up missing out on an awful lot.
QBR
ESPN created QBR in 2011 in an attempt to put a single number on quarterback performance. Any effort to do this is sure to create some outrage, as there's zero chance the stat will always show what we expect to see or want to see, and debates over quarterbacks unfortunately seem to be the lifeblood of sports twitter (I'll save that rant for another day).
However, QBR does a few things that other quarterback metrics typically haven't done, starting with including the impact of sacks and rushing production — an obvious shortcoming of the outdated 'passer rating' stat. Other metrics, like pro-football-reference.com's adjusted net yards per attempt (ANY/A), do subtract sack yardage but still don't account for rushing yards, rushing TDs and fumbles.
QBR also has the advantage of being built around an expected points (EPA) framework, which means it can account for the massive value difference between a seven-yard completion on 4th-and-6 and a seven-yard completion on 4th-and-8. That's obviously an extreme example, but there are plenty of other instances where the box score just doesn't show real-life value.
One player that comes to mind is Peyton Manning, who technically threw more interceptions than one would expect of an all-time-great QB. Part of that was just a matter of elevated volume, but I also remember how he'd chuck it downfield if he didn't have anyone open on third down, realizing that a deep interception wasn't much worse than an incompletion when the punt team was getting ready to take the field anyway. QBR can account for the difference between a classic Manning pick and something like this:
¡Pick six de los @Buccanners! 🏈🏃♂️💨
Vernon Hargreaves III lee a la perfección a Jimmy Garoppolo y pone los primeros puntos para su equipo.
3-7 #SFvsTB#NFLMX #GoNiners #GoBucs pic.twitter.com/LHRRpFgb0D
— NFL México (@nflmx) September 8, 2019
Some other things QBR does?
- Attempt to divide credit between QB and pass catcher, based on yards after the catch relative to the typical yards after catch for a reception at a given target depth and location. In other words, a screen pass that goes for 80 yards won't boost QBR by nearly as much as a perfectly thrown deep ball.
- Discount stats accrued in garbage time, when one of the two teams has an extremely high win probability.
- Total QBR, a spin-off of raw QBR, includes an opponent adjustment to account for the quality of defenses a passer has faced.
If you're looking for a better explanation, ESPN analytics specialist Brian Burke does a nice job of breaking it down in this quora reponse.
We should also remember that a five-point difference in QBR doesn't definitively mean one player was/is superior to another. Personally, I look at a variety of stats to judge QB performance, including QBR, NY/A, CPOE (completion percentage above expectation, via NFL Next Gen Stats) and PFF grades. There will always be some numbers that are surprising/frustrating/disappointing, but we could say the same — and then some — if we merely relied on "traditional" statistics (Ryan Tannehill was the 2019 leader in passer rating, and Jameis Winston was the leader in yards).
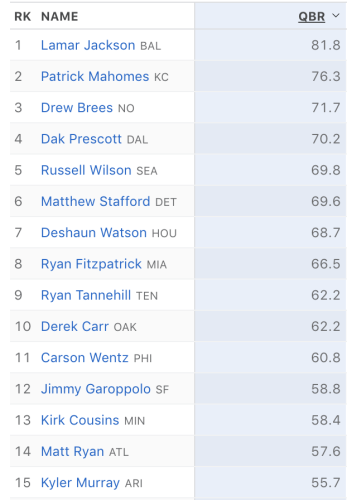
Anyway, QBR-related complaining seems to have died down of late, perhaps because the 2019 leaderboard largely corresponded with popular opinion:
DVOA
One complaint I've heard about DVOA is that it must not be all that useful if it's being published to the public rather than being used to bet on games. To call this argument flawed would be an understatement.
For starters, it's extremely difficult to create a model that can spit out picks that beat betting lines with enough regularity to overcome rake and earn a significant profit. Few have done it, and some of those who have done it also rely on a degree of subjective analysis, or maybe have a part of their formula that allows for subjective tinkering.
Then there's the fact that DVOA wasn't even created as a betting tool, i.e., people are criticizing it for not being something that it isn't trying to be in the first place It does have some predictive value, which we'll discuss later, but it kind of awkwardly toes the line between being a predictive stat and a descriptive one (an important distinction that I won't discuss now, but here's a link if you want a quick read).
Keep in mind that DVOA doesn't account for injuries, suspensions, etc. It tells us how a team has performed, with weighting based on stats that are "stickier" (the ones that tend to hold up over time). Like I said, it awkwardly toes the line between predictive and descriptive... which is only a bad thing if you aren't aware of it!
We may not be able to use DVOA alone to beat betting lines, but it's a good tool to have in the kit. Did you know that season-end DVOA is better than both W-L record and point differential (pythagorean expectation) for predicting W-L record in the following season? Yeah, that's useful. Also, it's bad news for Packers and Texans fans, but good news for Dallas and Philly.
Another thing DVOA does is adjust for opponent, and down-weight the impact of rare events like 80-yard plays. This is useful during the season when we're trying to estimate the future performance of a team's pass defense or run defense, i.e., trying to find the best matchups for our QBs/RBs/WRs/TEs.
Allowing one or two huge plays early in the season essentially ensures that a defense will have a poor mark for YPC allowed through September and maybe even into October. But there isn't much predictive power in those "freak" plays — a defense that gives up two long runs but otherwise stuffs RBs is likely to be a tough matchup in the future even if the stat sheet says 4.6 YPC.
Now, we need to remember that all defensive stats have limited predictive power, especially early in the season when working with a limited sample. It's nice to know that a defense is No. 7 in DVOA against the run, but that doesn't automatically make them a bad matchup for a running back. The point is that it's better than using YPC or total rush yards, not that it's perfect.
Long story short... it isn't Football Outsiders' fault (or PFF's, or ESPN's) if we make the mistake of being overly reliant on a single metric. There's nothing wrong with pointing out shortcomings, but we're only hurting ourselves if we use frustration over those shortcoming as an excuse to rely on more familiar statistics that are far less useful — YPC, passer rating, YPA, etc.