This article is part of our Rounding Third series.
The Background
The Xperts Fantasy League (XFL - so named by Steve Moyer when it was founded in 2003 as a bit of a mock Experts Leagues, and of the XFL football league that went defunct in 2001) is a hybrid between a keeper and dynasty league. We auction each year at First Pitch Arizona, the awesome fantasy baseball conference centered on the Arizona Fall League that was founded by Ron Shandler and Rick Wilton and is still run by BaseballHQ.com each year.
We then do a March supplemental snake draft online to fill out our 17-man reserve rosters – minus any minor leaguers that we keep from year-to-year. You can only keep 15 players total between major leaguers with their respective salaries and minor leaguers that have no salaries (hey, almost just like real life!). I've never come close to winning the league after joining in 2011. It's embarrassing that I've never done very well in this league.
Our March Supplemental draft was scheduled for late March, and the COVID-19 shutdown forced us to push that back. When we were deciding a date to reschedule that draft, we obviously didn't know how long this shutdown would last (and actually, still don't), and rescheduled it for this week, on Monday night. Of course, because we still don't know if/when MLB will resume, there's good reason to refrain from completing the supplemental draft in a keeper/dynasty league. But we all need some fun activities to pass the time, and perhaps generate good content for our readers along the way.
That's why Ron Shandler proposed we do a retroactive draft of a previous season. The concept is simple — even if you know the stats of the players, there's a tremendous amount of strategy constructing the best roster in a roto-style draft. In fact, Ron used to run a "previous year's auction" at First Pitch Arizona in the past with the same concept. To save some time, given that we're all online and not in person, and no commish service that we're aware runs retroactive auctions, we decided to make this a snake draft. Ron suggested 1982 as our first year — it's the very first official year of Rotisserie Baseball (as it turns out, that's not the case - 1980 was the first year - Error Erickson (2,411 — just this year!)), founded by Daniel Okrent and popularized by Glenn Waggoner (please, please read the article about Waggoner in The Athletic by Nando Di Fino) — why not pretend to be pioneers for a night and go down memory lane? Unless you're our good friend Derek VanRiper and weren't born yet, that is, in which case learn about many of these players for the first time.
Todd Zola generated a spreadsheet for us to track the draft using a program he offers at Mastersball, and we drafted players using another spreadsheet Todd created to help us do our drafts in the XFL on a Google doc. We had a list of eligible players with their stats, all listed at just one position, to help avoid complications about where a given player would qualify. From there, it was up to us to generate our own draft rankings and strategy. Given that most of the participants are in the industry, and all are veteran players, it shouldn't be too much of a daunting task.
The Process
My first step was to convert the player stats into dollar values to create my rankings — pitchers and then overall hitters first, and then sort out the hitters by position. I prefer to use SGP's (Standings Gain Points) to create those dollar values, as first described by Art McGee in "How to Value Players for Rotisserie Baseball." It's my go-to resource after all these years when I turn my projections into dollar values. You don't need to have dollar values to create rankings, but it helps me conceptualize the rankings better for an exercise like this, particularly when I want to see how big the gaps are at certain positions, or even overall. Are there distinct tiers that you can exploit? Can you find a way to bridge the gap at scarce positions? With an auction value ranking system, yes, you can do that. We'll talk about some of the specific gaps shortly.
Even though we already know what the players are going to do, it's still not a simple exercise to determine the values. Why is that? We need to know the MLB context in a given year, and to estimate how much early draft capital the league will invest in hitting compared to pitching.
For the MLB context, ask how prevalent are home runs, stolen bases and every other category? How many of each will we need to compete in those categories? The good news is that we know how often these event occurred in 1982. Just go to Baseball-Reference.com and peruse the MLB League Year-By-Year Averages. As everyone well knows by now, last year was a record-setting year for home runs, with teams averaging 1.39 homers per game. In 1982, teams averaged a mere 0.80 homers per game. Conversely, in 2019 MLB teams averaged only 0.47 stolen bases per game, compared to 0.75 in 1982 — led by Rickey Henderson's whopping 130 stolen bases. From there, we can try to estimate how many of each category gains us a point in the standings — I won't belabor the details here, read the book, it's short and so well-explained that I won't deprive you the pleasure of learning on your own! Rumor has it, most of us have more time on our hands to read anyways. We won't have a slew of 1982 leagues to draw data from on that point, but you can probably develop a good working estimate at least.
The second step is to guess at what sort of "split" the league will use in valuing the players between hitters and pitchers. Traditionally, fantasy baseball players as a collective whole have allocated between 65-70 percent of their auction budgets on hitters. Subsequent studies into the NFBC draft results suggest that their drafters apportion their picks in a similar value. Why is that? It's not, as has been suggested, because our rosters include 14 hitters and nine pitchers (at least, in the original game) per team. It's more because there are two qualitative categories in pitching and one in hitting, and moreover, there's more volatility in the pitching pool than the hitting pool. The latter factor means that with pitching your failure rate is considerably higher, and the consequence is that more of the pitching value comes into the league via the waiver wire. Peter Kreutzer described this as the "free loot" problem in devising an allocation strategy for our leagues.
But in a retroactive draft, this second factor isn't present. We know exactly what these pitchers are going to do! We might value them improperly, we might not get the pitcher we need to fit our team's context, but so much of the volatility was stripped away. As a result, shouldn't our value allocation be closer to 50-50? If so, the dollar results from any formula would be astonishing. Look at our Earned Auction Values calculator on RotoWire, using 2019 as an example. With a 65-35 split, Justin Verlander ($48) and Gerrit Cole ($45) out-earn Ronald Acuna ($39), Cody Bellinger ($38) and Christian Yelich ($38) comfortably. Change that allocation to 50-50, and you'd be astounded how many pitchers top the highest-valued hitters, and the margin in which Verlander and Cole dwarf Acuna, Bellinger and Yelich. Play around with the calculator to see for yourself!
I wanted to set my value allocation at 50-50, but I estimated that not all of my competitors would see it that way, or want to draft accordingly. So I kept my allocation at a conservative 65-35, just to try to estimate what everyone else was seeing, but all along resolving to attack pitching early to build a good base. I drew the 11th pick in this 12-team league, so I was really hoping that my guess about the league's behavior was correct.
Dollar Value Observations
Before getting into the results, here are a few quick observations I drew from computing my dollar values. Rickey Henderson stole 130 bases and scored 119 runs, and was the most valuable hitter without adjusting for positional scarcity ... but only barely. Using a 65/35 split, and my estimate for how many stolen bases would gain you a standings point for each category, I had Henderson worth $34, just ahead of Robin Yount's $32. At this point it's worth noting that Art McGee's book accounted for positional scarcity, not just for catcher, but also for second base and shortstop. If you look at the dollar values for the top middle infielders, you can see why:
Shortstops
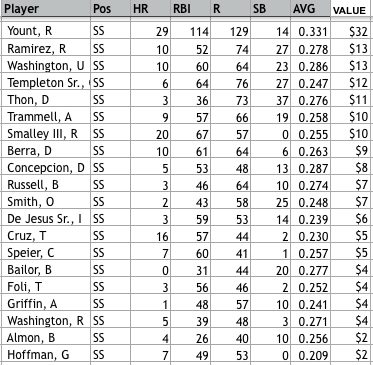
Look at that massive difference between Robin Yount and everyone else! Can you imagine what his value would be if we gave middle infielders a positional scarcity bump? Only one other shortstop had even 20 homers, and his Runs/RBI nearly double everyone else at the position. Given the gap here, it makes sense that Yount went before Henderson in our draft.
Second Basemen
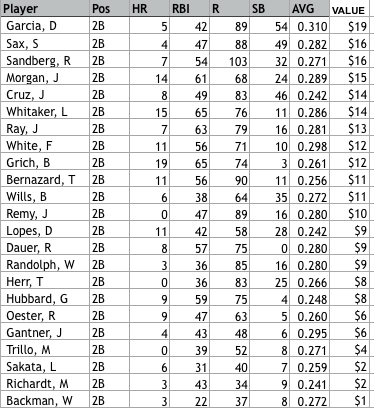
We don't have the separation at second base, because we don't even have the upper tier at all. Damaso Garcia (recent RIP) led the way with his 54 stolen bases and 89 runs, but it's a position that's changed quite a bit over the decades. Bobby Grich led the position with 19 homers, and had passable counting stats, which became my priority later in the draft.
Compare the middle infielders to the overall hitters that are $20+:
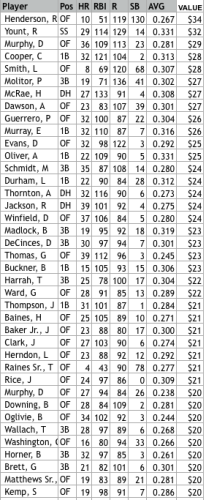
There's quite a few outfielders and corner infielders, and just one middle! There's plenty of representation from those positions in the teens as well — which came in handy for me later on. The depth at these positions helped dictate my plan for the early rounds, which was to load up on good-ratio pitchers. To help explain, here's the top of the pitcher value page:
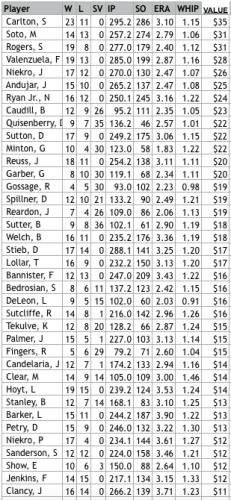
That's right, even with a 65-35 split, my numbers had Steve Carlton as the most valuable player overall at $35. Even accounting for possible (likely!) errors in my calculations, it's pretty clear that if drafted with anything closer to a 50-50 split in mind, I was going to go pitching-heavy early, especially out of the 11 spot, where the true standouts among hitters (Yount, Henderson, Paul Molitor) were certain to be gone.
I wanted to emphasize good ratio pitchers, especially those with low WHIPs. While it was readily apparent that this was a lesser home run year, and with that a lower ERA year, it might surprise you that the average pitcher's WHIP was higher in 1982 (1.345) than in 2019 (1.334). If I could tackle my ratios early, it would allow me some flexibility late in the draft for my last couple of pitcher slots — I could try to compile wins or saves with a little more impunity, depending on which category looked like a better target to gain points. Once again, knowing exactly what these pitchers would produce instead of speculating gives you that freedom.
The Draft
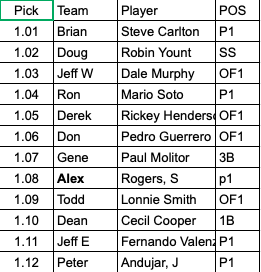
Here's the full draft order:
- Brian Feldman - www.fantasybaseballauctioneer.com
- Doug Dennis - BaseballHQ.com, XFL defending champ
- Jeff Winick - Multi-season winner in the XFL
- Ron Shandler - ronshandler.com, Commissioner of the XFL, Founder of BaseballHQ.com
- Derek VanRiper - The Athletic
- Don Drooker - Another multi-season XFL champ
- Gene McCaffrey - The Athletic
- Alex Patton - www.alexpatton.com
- Todd Zola - RotoWire, Mastersball.com, ESPN.com
- Dean Peterson - Strat-o-Matic genius, formerly Stats Inc.
- Jeff Erickson - Long-time bottom tier XFL player
- Peter Kreutzer - AskRotoMan.com
The draft began with a minor surprise (I thought that Henderson or Yount would go first) when Brian Feldman took Carlton at 1.1. But as alluded above, when we strip away the volatility of pitchers (including the annoying "pitched well but didn't get the win" part), it makes perfect sense. Here's how the rest of the first round went:
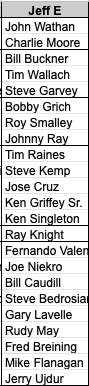
When Ron took Mario Soto at 1.4, I felt a twinge of sadness. Soto was not only my second-highest rated pitcher, and him going that early, ahead of Henderson, made me wonder if my pitcher strategy was going to be viable, but as a Reds fan, he's one of my top three favorite Reds of all time (George Foster and Joey Votto are the others). But only one other pitcher went before my pick at 1.11, and I debated between Fernando Valenzuela and Joe Niekro with the selection. Fernando had the 19 wins and 69 more strikeouts, so I went with him despite the lesser ratios (2.87 ERA, 1.16 WHIP vs. 2.47 and 1.07 for Niekro). Luckily, I still got Niekro at 2.2 (14) when Peter added Joaquin Andujar and Andre Dawson at the turn. I would have probably gone with Andujar had Peter taken Niekro, but fortunately I got a slightly better WHIP, five more innings and two more wins at the expense of seven strikeouts. Todd's posted the full results, and I tweeted out every round during the draft. Instead, I'll just share a quick comment about my picks. First, here's my full team.
After my Niekro pick, which disappointed Todd greatly, six more pitchers went in second round, giving the draft a perfect 50-50 hitter/pitcher split. Uh-oh, maybe I guessed wrong about the league's draft behavior? Fortunately, no — the third round brought just one other pitcher taken before my next pick.
3.11 - Bill Caudill (12 wins, 26 saves, 95.2 innings, 111 strikeouts, 2.35 ERA, 1.05 WHIP): Caudill was my highest valued closer and eighth-rated pitcher overall, so I was thrilled to get him here. Closers were a lot different in 1982 — more innings, more wins, but fewer strikeouts per inning. Caudill was a noteworthy exception.
4.2 - Bill Buckner (.306, 15 HR, 105 RBI, 93 R, 15 SB) - Another recent RIP, how many of you think of Buckner on the Red Sox, barely able to run, toward the end of his career? This was a much different iteration of him. Arguably I should have taken Dan Quisenberry to double up on closers here (again, no volatility!) and get more superior ratios. But ... even drafting under a 50-50 split means you still have to compete in the hitting categories too! Quiz went with the next pick.
5.11 - Steve Bedrosian (8 wins, 11 saves, 137.2 IP, 123 K, 2.42/1.15) - The fourth round brought an epic closer run, but much like the third round, the fifth round was hitter-heavy, so I got my fourth pitcher with great ratios, and the first to get a fourth pitcher. Now I had the freedom to just go best available hitter for a few rounds.
6.2 - Tim Raines (Sr.) (.277, 4 HR, 43 RBI, 90 R, 78 SB) - Honestly, I didn't think I could get Raines this late with that stolen base total, and if I didn't get him I wouldn't have tried to compete in the category. But he was there, and that gave me a nice base to at least place halfway in the standings there.
7.11 - Tim Wallach (.268, 28 HR, 97 RBI, 89 R, 6 SB) - I wanted to go P5 here, but Alex Patton and Todd Zola took my top two targets here, Jim Palmer and John Candelaria, so I decided instead to add two more bats given the tier drop in my mind.
8.2 - John Wathan (.270, 3 HR, 51 RBI, 79 R, 36 SB) - Yes, you read that right. Thirty six stolen bases from a catcher! Drafting catchers in a retro draft is similar to drafting pitchers — because we know what they've already done, a lot of the injury-related volatility is removed. It's just a question of valuation and fit.
9.11 - Steve Kemp (.286, 19 HR, 98 RBI, 91 R, 7 SB) - Before he was a free agent bust with the Yankees, Kemp was actually pretty good. In 1982, he delivered a lot of sweet, sweet counting stats.
10.2 - Gary Lavelle (10 wins, 8 saves, 104.2 IP, 76 K, 2.67/1.20) - Lavelle had a 2.93 ERA over his 13-year career, mostly with the Giants, and made two All-Star teams. Tough crowd.
11.1 - Bobby Grich (.261, 19 HR, 65 RBI, 74 R, 3 SB) - I resolved to grab two MI's at this turn, knowing how weak each position was about to get. I went with power and counting stats over speed with this and my next selection.
12.2 - Roy Smalley (.255, 20 HR, 67 RBI, 57 R, 0 SB) - Second highest SS-HR total, and good counting stats, though again no speed and a lower average made this an uncertain pick.
13.11 - Johnny Ray (.281, 7 HR, 63 RBI, 79 R, 16 SB) - I knew I needed another low-ratios pitcher and had Ron Reed in my sights lined up, but (a) Ray stood out as a huge bargain among MI's at this point, and (b) I thought that there was a better chance Reed might slip through to me. But that miscalculation (Reed went next to Peter Kreutzer) might have been a critical mistake in my favor, insomuch that I ultimately took a different fork in the road later in the draft.
14.2 Steve Garvey (.282, 16 HR, 86 RBI, 66 R, 5 SB) - I remember reading that when Garvey (later, when he was in San Diego) got caught cheating on his wife and fathering children out of wedlock, a popular bumper sticker read "Steve Garvey is not my Padre."
15.11 Jose Cruz (.275, 9 HR, 68 RBI, 62, 21 SB) - How much better would Cruz's career be remembered had he not spent the vast majority of his career playing in the Astrodome?
16.2 Rudy May (6 W, 3 SV, 106 IP, 85 K, 2.89 ERA, 1.16 WHIP) - Another ratios play — that made six pitchers with sub-3.00 ERAs, which allowed me to grab some wins with worse ERAs later. I was now aware that both Peter and Todd were taking low-ratio pitchers, too, at the expense of other stats, and that I was unlikely to better them in WHIP.
17.11 Fred Breining (11 W, 0 SV, 143.1 IP, 98 K, 3.08/1.38) - My first WHIP sacrifice in order to chase wins, after took Dave Dravecky (2.57/1.13) two picks before me. Breining was the first player that I drafted who I didn't remember from my days of collecting baseball cards. This was the first of his two 11-win seasons. He was part of a trade that netted the Pirates Bill Madlock on his way into San Francisco, and went for a late-career Al Oliver on his way out.
18.2 Ken Griffey Sr. (.277, 12 HR, 54, 70 R, 10 SB) - I sure took a lot of players whose kids later made it to the majors. When Peter took Oscar Gamble and his 18 homers at the turn, it forced me to devalue power and instead focus on R/RBI the rest of the way. That turned out to be fortuitous. At this point, as the standings were getting updated with each pick, I was competitive with Brian and Peter most frequently intersecting with me in the standings. I'd look great after my even-round picks, and then have to wait for 20 more players before I could pick again, finding myself dropping back to the middle of the pack.
19.11 Mike Flanagan (15 W, 0 SV, 236 IP, 103 K, 3.97 / 1.31) - 236 innings of below-average ratios were going to hurt, but again, I had some cushion from my earlier pitchers, which made those 15 wins from my P8 pretty sweet.
20.2 Ken Singleton (.251, 14 HR, 77 RBI, 71 R, 0 SB) - "I'll take Hall of the Very Good Orioles for $800, Alex." I debated Griffey vs. Singleton in the 18th round and viewed this as a bit of a windfall, even though it cost me sentimental points in not drafting George Foster. Still, he was my last OF worth $10-plus — not bad for OF5.
21.11 Ray Knight (.294, 6 HR, 70 RBI, 72 R, 2 SB) - More counting stats goodness from a late pick. I also had Knight worth $11, and that put me in really good shape in RBI/R. I think I gained 5-6 points from the trio of Griffey/Singleton/Knight.
22.2 Charlie Moore (.254, 9 HR, 45 RBI, 53 R, 2 SB) - The law requires two catchers, Charlie Moore was a catcher. Plus, his two bags earned me a half-point over Gene McCaffrey.
23.11 Jerry Ujdur (10 W, 0 SV, 178 IP, 86 K, 3.69/1.23) - My second player that I don't remember at all, for good reason. Ujdur had 10 wins for Detroit in 1982, and two the rest of his career. I just wanted to earn a couple of points in wins without crushing my ratios, just in case there were some late stat corrections that reduced my lead.
The Results
As it turns out, there were some overnight stat corrections that narrowed my lead by a few points, so it was a good thing I got those extra points in wins. I was able to pull it out, though, edging out Brian Feldman, 77 to 73.5.
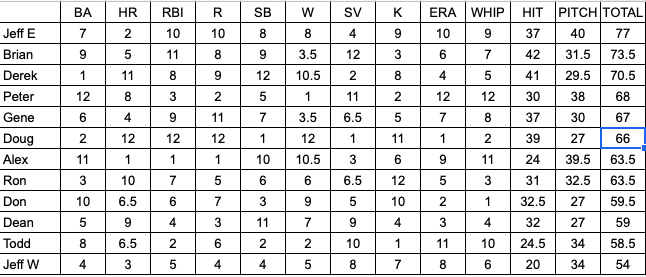
And here are the category totals:
At least for this draft, it was helpful to have a relatively balanced team. Doug Dennis and Derek VanRiper dominated the hitting categories, though DVR went too heavy with speed. Peter and Todd had dominant pitching ratios, but at the expense of wins and strikeouts. Meanwhile, I didn't win or even finish second in a single category. I suspect I got a little lucky, as we're going to be able to better track the categories in real time, thanks to some modifications that Todd made with his live draft tool.
Does this mean I have an XFL title? Or maybe can improve my all-time stats in Tout Wars? No, alas, it does not. But this was a thoroughly fun exercise and trip down memory lane. I can't wait for the next one, which is Monday, May 4. As the winner of this one, I got the right to choose our next one. The Reds last won the World Series in 1990, so I can't wait to position myself to take Jose Rijo and Eric Davis!