This article is part of our MLB Barometer series.
In my last article, I compared the dollar values from two projection systems (RotoWire and Derek Carty's 'The BAT') to January NFBC Average Draft Position data, in the hopes of unearthing hitters that both sets of projections saw as undervalued in the current market.
(You can read more about the process in that piece.)
Naturally, I wanted to use the same approach this week to find values on the pitching side.
I expected to find another treasure trove of value, write up 25-30 pitchers that you should strongly consider at their respective prices, and skate off to a new topic next week.
Unfortunately, there were only 14 pitchers who showed up as undervalued at their January ADP compared to their projections in both systems, and 12 of them are going outside the Top 350 overall.
I moved past my feelings of disappointment quickly, since I only spent an hour or so in total compiling all of the original data for these two articles, and there are scientists who spend their entire careers doing research only to come away with inconclusive results.
I think the explanation for the limited number of undervalued arms using the method is actually pretty straight forward. Pitchers get pushed up NFBC draft boards to a higher pick value than their actual projected dollar value, which leaves a lot of the undervalued hitters to be scooped up at a discount.
In some instances, the draft market (NFBC ADP) might be sharper with aging hitting than projections
In my last article, I compared the dollar values from two projection systems (RotoWire and Derek Carty's 'The BAT') to January NFBC Average Draft Position data, in the hopes of unearthing hitters that both sets of projections saw as undervalued in the current market.
(You can read more about the process in that piece.)
Naturally, I wanted to use the same approach this week to find values on the pitching side.
I expected to find another treasure trove of value, write up 25-30 pitchers that you should strongly consider at their respective prices, and skate off to a new topic next week.
Unfortunately, there were only 14 pitchers who showed up as undervalued at their January ADP compared to their projections in both systems, and 12 of them are going outside the Top 350 overall.
I moved past my feelings of disappointment quickly, since I only spent an hour or so in total compiling all of the original data for these two articles, and there are scientists who spend their entire careers doing research only to come away with inconclusive results.
I think the explanation for the limited number of undervalued arms using the method is actually pretty straight forward. Pitchers get pushed up NFBC draft boards to a higher pick value than their actual projected dollar value, which leaves a lot of the undervalued hitters to be scooped up at a discount.
In some instances, the draft market (NFBC ADP) might be sharper with aging hitting than projections systems still "like" based on their high volumes of playing time and reasonably long track records of success, but age is often a trait that skews player evaluations.
Nevertheless, the only two starting pitchers revealed to be undervalued by both projection systems relative to their January ADP were Justin Verlander (23.00) and Rich Hill (178.12).
Justin Verlander, P, HOU | Jan ADP: 23.00 | AVG: $32.0 | Diff: $4.7
Verlander turns 36 in February and Hill turns 39 in March, and ultimately, I think that has a lot do to with why their projection-driven value exceeds their draft-day cost. There is a market-based bias against older players in general.
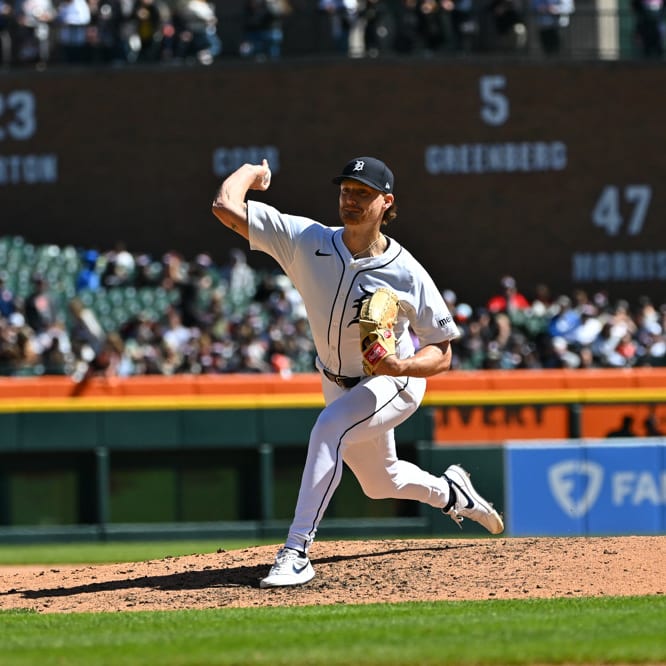
In a 12-team league, Verlander is often available to the owners who picked first or second in the first round, which opens the door for a Mike Trout/Mookie Betts, Verlander + another top-20 hitter trio to start a draft. And yet, if I had been given one of those draft slots and was left with my choice of Verlander and his teammate Gerrit Cole, my initial lean would have been to take Cole over Verlander even though the latter is arguably coming off the best fantasy season of his career.
In terms of maximizing player performance, especially on the pitching size, the Astros appear to be the sharpest organization in baseball at the present time.
Verlander was pitching at a still-good 3.5-4.0 WAR level when the Tigers sent him to Houston late in 2017 (3.82 ERA, 1.28 WHIP, 24.1% K%, 9.2% BB%, 10.1% SwStr%). Immediately after his arrival in Houston, the strikeout rate soared to 35.8%, he cut his walk rate by more than half (4.2%) and he was getting enough swinging strikes to backup the increase in whiffs (14.2%).
Naturally, it was easy assume that was a small sample mirage, and to chalk up the success to Verlander playing for a contender again and getting a mental lift of sorts at the end of the season, even though he also pitched well in the postseason en route to the Astros' World Series title. That postseason run and 34 September innings weren't enough for the market to treat him as a top-five pitcher. Instead, he was a consolation ace of sorts, with a 2018 NFBC ADP that fell inside the Top 40 overall, but behind the likes of Stephen Strasburg and Noah Syndergaard by 10-15 picks in most draft rooms.
He was a profitable third-round pick last season, and the underlying numbers make it easy to see how he did it. Statcast data from Verlander's 2018 season is impressive, to say the least.
By comparison, Gerrit Cole's marks were as follows:
Other than velocity, Verlander was better than Cole across the board last season, though it's fair to say that both were excellent, and the difference in ADP is relatively small, with Verlander going about five picks earlier than Cole in January.
Given the way that Chris Sale's second half and postseason played out, is Verlander with a heavier career volume of innings on his arm, actually more risky? Does he offer any less upside? Max Scherzer will turn 35 in July, and he's generally the first pitcher off the board, sometimes in the first half of the first round.
Here's a look at the Top 12 Starting Pitchers off the board based on January NFBC ADP data since Verlander's arrival in Houston in September of 2017.
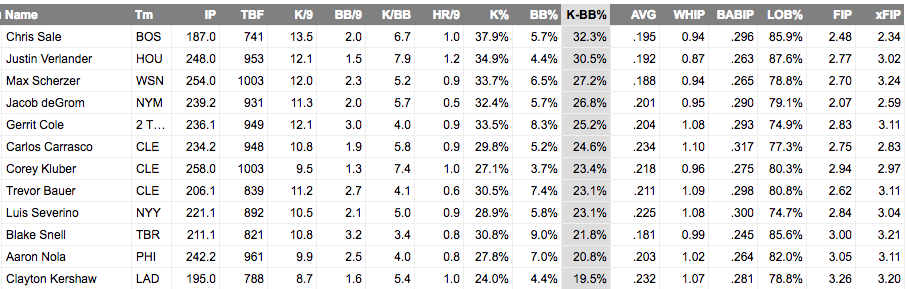
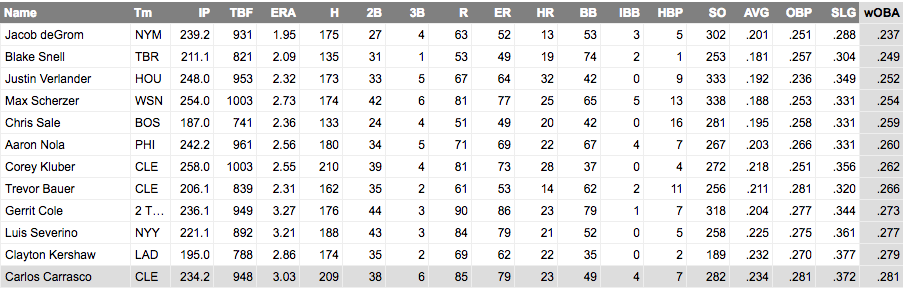
(Tables generated with the custom leaderboard splits tool at FanGraphs.)
It's strange to think that a pitcher who is going in the Top 25 overall and is among the first five arms drafted can be undervalued, but the performance in Houston has been at another level. Only Sale has a higher K-BB% during that span, and he's thrown 61 fewer innings. Verlander is third from the group in wOBA allowed (.252), while only Kluber (10) and Scherzer (6) have logged more innings.
At the very least, I've got a clearer preference from the group of starting pitchers in the second round if I choose to draft one in that range, and I'll be ready to save a few bucks if Verlander falls short of the auction prices commanded by other top-end starters this spring.
Rich Hill, P, LAD | Jan ADP: 178.12 | AVG: $32.0 | Diff: $4.7
Hill has burned owners at various points in recent years, dealing with the Super Blister on multiple occasions, losing the feel for his curveball for stretches, and cratering ratios before hitting the DL. He's made 24 and 25 starts the last two seasons, so he'll project comparably to many other starting pitchers in play outside the Top 150.
The blister problem may have been solved for good last spring, when Hill used a combination of frequent laser treatment and buckets of rice to keep his middle finger healthy, according to the Orange County Register.
A good team context brings up Hill's floor to earn wins, he's hovered around a 20.0 K-BB% over the last two seasons, and the ratios are likely similar to that of J.A. Happ at a slightly lower price because of the projected workload differences.
I'll likely end up with Hill on a few teams again in 2019 if that January price holds.
As for the other undervalued arms, here's a look at the rest of the group, which looks like a mix of endgame flyers and potential streamers to target for favorable matchups and two-start weeks as many of these pitchers will end up shuttling on and off the bottom of mixed-league rosters.
There are a few that stand out, as detailed below.
Jake Odorizzi, P, MIN | Jan ADP: 373.12 | AVG: $2.5 | Diff: $3.3
Blake Parker, P, MIN | Jan ADP: 373.46 | AVG: $3.7 | Diff: $3.3
Brad Peacock, P, HOU | Jan ADP: 378.35 | AVG: $3.4 | Diff: $4.4
Anthony Swarzak, P, SEA | Jan ADP: 381.77 | AVG: $2.9 | Diff: $4.0
Trevor Richards, P, MIA | Jan ADP: 390.46 | AVG: $1.8 | Diff: $3.1
Yonny Chirinos, P, TAM | Jan ADP: 398.92 | AVG: $2.5 | Diff: $4.1
CC Sabathia, P, NYY | Jan ADP: 409.65 | AVG: $2.0 | Diff: $3.9
Danny Duffy, P, KC | Jan ADP: 420.73 | AVG: $0.3 | Diff: $2.4
Keone Kela, P, PIT | Jan ADP: 435.00 | AVG: $1.2 | Diff: $3.7
Chad Green, P, NYY | Jan ADP: 452.77 | AVG: $2.7 | Diff: $5.9
Ryan Brasier, P, BOS | Jan ADP: 454.92 | AVG: $2.4 | Diff: $5.6
Odorizzi ranks in the 30th percentile or worse in most of the Statcast metrics featured above in the Verlander and Cole analysis (fastball velocity, curveball spin, xwOBA, xSLG and hard-hit percentage). The Twins will see plenty of the White Sox, Tigers, and Royals, however, and Odorizzi will be a viable pitch-and-ditch option as the old Fantasy 411 crew used to say. One interesting thing to point out -- while Odorizzi lacks premium velocity on his four-seamer, he's elevating it in the strike zone to get more whiffs in Minnesota, so his strikeout gains might be sustainable, even if he's a slight ratios liability due to his walk rate (above 10.0% in back-to-back seasons).
I don't expect Parker to be good enough as a non-closer reliever to make a positive impact outside of AL-only leagues, so his value hinges entirely on the outcome of a potential battle with Trevor May for the ninth-inning role in Minnesota.
Peacock is very good. Last season, he struck out 35.3% of the batters he faced while making all but one of his 61 appearances for Houston out of the bullpen. Peacock and Ryan Pressly are two Astros relievers worth using as staff fillers even if they're unable to displace Roberto Osuna from the closer role. Reducing the use of his four-seamer over the last two seasons has been a positive shift in his pitch mix, as he's been yielding less hard contact by using a sinker instead. Additionally, Peacock's slider has generated a whiff rate above 40 percent in each of the last two seasons, and he leaned on that pitch at a career-high 40.2% rate in 2018.
The Mariners are among the teams without a clear-cut closer as pitchers and catchers report to spring training this week. Swarzak's one and only year with the Mets was a disaster, as he was limited to just 26.1 innings with shoulder and oblique injuries, and plagued by control and home-run issues along the way. He was dumped to Seattle as part of the trade that sent Robinson Cano to Flushing early in the winter, and might become a useful third source of saves in mixed leagues if he takes over the ninth-inning role at some point, but I don't want him on my rosters without a confirmation that he'll receive an opportunity to finish games.
Richards throws one of the nastiest changeups in baseball (41.2% whiff rate). His four-seamer is a problem, however, as opposing hitters hit .310 with a .522 slugging percentage against it, and he leaned on the pitch more than 50 percent of the time. Richards also throws a slider, which improved in terms of whiff rate over the course of the year (18.8% whiff rate overall), but his margin for error with command is slim. The Marlins are a disaster, so he should have plenty of leash in the rotation in terms of job security, but there's not quite enough here beyond the changeup to take the late flyer, especially with the NL East getting tougher this offseason.
Chirinos showed three pitches with a whiff rate above 30 percent as a rookie last season (slider, split-finger, four-seamer), but he works with a sinker that can touch 95 mph as his primary offering. I think there is something here -- results that will be greater than the sum of the parts -- in part because I trust the Rays to optimally use him to maximize his success. I believe the projections systems undersell Chirinos mostly because of the uncertain workload volume. The market probably overlooks him because he's not a flashy high-pedigree prospect with overpowering stuff and a track record of gaudy minor league strikeout rates. I will likely have him on several rosters, perhaps even in 12-team mixed leagues.
Sabathia's average start was 5.27 innings in 2018, and at age-38, he'll continue to get early hooks with the Yankees having a crazy-deep bullpen. As a result, his win probability is lower than it should be for a starter on such a strong team. His value hinges maintaining last season's four-year high in K% (21.1%) and keeping his ERA under 4.00 again, which he's done in three straight campaigns despite a FIP above 4.00 annually since 2013. I see Sabathia as more of a waiver-wire streamer, like Odorizzi, in most mixed formats.
Duffy's 25.7% K% in 2016 appears to be an outlier, as he's been closer to 20.0% in each of the last two seasons, while averaging just over 150 frames annually. One big difference since that 2016 peak has been the loss of fastball velocity (94.8 in 2016, 93.1 in 2018) and a reduced usage of his slider, but another key change to his approach was the disappearance of his curveball, which returned around June. Over his final 16 starts, Duffy had a 21.7% K%, but he was less susceptible to the long ball (0.90 HR/9) and his FIP checked in at 3.92 (4.28 ERA). He's still in play for me as an occasional streamer this season.
Kela is a good late-inning reliever with an injury history that may prevent the Pirates from pushing his workload beyond 60 innings. If anything happens to Felipe Vazquez, he's my favorite to close in Pittsburgh, and the improved walk rate (9.0%) paired with an increased swinging-strike rate (13.0%) bode well for his chances of being a positive contributor in strikeouts and with ratios again, but the aforementioned concern about his workload makes him a tough player to roster in mixed leagues if he's not getting saves.
Unlike a few of the other relievers in this piece, Green *can* be good enough without recording saves to be used as a staff filler in a lot of mixed formats, but that statement is now conditional. His velocity ticked up last season, though it's somewhat interesting that he scaled back the use of his slider to a career-low 10.2%. If Green can regain the feel for his slider, or find some other useful second pitch, he can keep hitters from sitting on his fastball, which will make him less susceptible to hard contact.
Brasier went four seasons without appearing in a big-league game before taking on a prominent role in the Boston bullpen last season. Tommy John surgery wiped out his 2014 season, he spent 2015 rehabbing in the minors, 2016 in Nashville, and 2017 in Hiroshima. With Craig Kimbrel still available on the free agent market, save chances are available, and while Matt Barnes might be the internal favorite to win the job if Kimbrel officially moves on in the near future, Brasier's fastball-slider mix generated a 15.8% swinging-strike rate last season, which hints at the potential for more strikeouts than the 23.4% K% he delivered in 2018. If the Red Sox refuse to name a closer as March approaches, Brasier will likely be an endgame flier that I'm willing to cut in the first few weeks of FAAB if he doesn't land the gig. It will be interesting to see if Boston prefers to have Barnes available in the seventh and eighth to get more than three outs, while trying limit and manage Brasier's workload by using him as a traditional closer. Last season, 30 of his 34 appearances were one inning or less.